
When using a rechargeable battery, you’ll want to know what its state of charge (SoC) is – how charged is it?
What you really want to know is how much longer your battery will last and whether you can safely draw more power from it or if you need to cut back, or if it’s time for a recharge. But first you must estimate how much charge the current battery is holding.
Why “estimate”? Isn’t there a way to be sure? Unfortunately, no, not exactly.
We’ll focus here on the 12 volt rechargeable batteries most commonly used with recreational vehicles and when camping. But similar considerations apply to all battery types.
AGM batteries
Absorbent glass matt (AGM) is the most common type of deep-cycle lead-acid battery.
As for any battery, the voltage of an AGM battery is highest when it is fully charged, and falls as it discharges.
By “voltage” we really mean the “at rest” voltage. This is the voltage measured when the battery is not connected to anything that’s drawing any current and the battery has not been used or charged for at least a couple of hours.
For an accurate reading, it’s important to rest lead-acid batteries after charging them. This is because the charging process occurs at the surface of the battery’s lead plates, creating a surface charge which takes some time to diffuse through the battery.
To charge a lead-acid battery, the charger applies some charging voltage to the battery and, if you measure the battery voltage at that point, you might conclude that the battery is fully charged. But what you’re seeing is the voltage delivered by the charger, not the true battery voltage. Even when you remove the charger, the battery voltage will remain high as the surface charge begins to dissipate, and then fall toward its true level over time. For this reason, some smart chargers periodically stop charging to measure the battery voltage before continuing.
In theory, the at-rest battery voltage depends on the state of charge, as shown in this example graph:
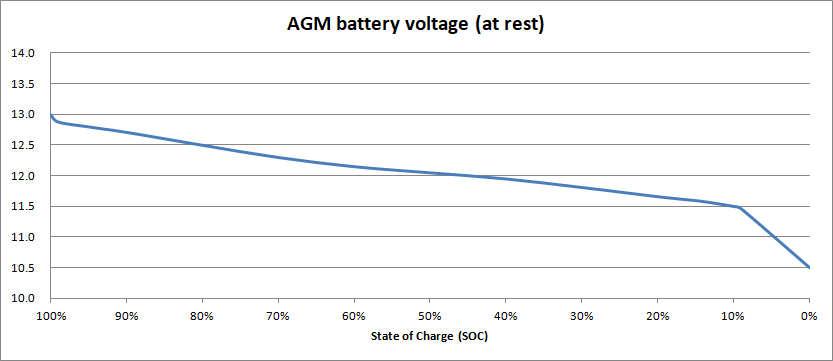
In this example, when the SoC is 50%, the at-rest battery voltage is 12.05 V. So, if we disconnect our AGM battery, let it rest for a few hours, and then measure its voltage and get a reading of 12.00 V (for example), the start of charge must be around 45%. Right?
Well, yes – assuming that the graph is correct.
If you search for “AGM battery state of charge chart”, you’ll find a lot tables and some graphs similar to this one. You’ll also find a lot of variation and disagreement. They can’t all be right!
One point of contention is: just what does “0%” mean? At what point is an AGM battery empty?
You’ll see in the graph above that the voltage falls fairly constant rate from 13V down to 11.5V. Then there’s a “knee” in the curve, where the voltage starts to fall rapidly – faster and faster.
One manufacturer specifies their 100 Ah AGM batteries as being able to provide 10 A for 10 hours (giving a 100 Ah capacity rating), at which point the voltage will be 1.80 V per cell, or 10.8 V in total. In other words, that manufacturer considers their AGM battery to be 100% empty (0% charged) when the voltage falls to 10.8 V.
And yet, even at 10.8 V, there is still some energy left. It’s still possible to extract a little more. On the other hand, if you did discharge a 12-volt AGM battery down to 10.58V, you’ve probably killed it. It’s not only dead, it’s never coming back.
That’s why you will often see the lower limit (0% SoC) for AGM batteries as 11.8 V. It’s a more realistic figure, that for the health of your battery you should never let it fall below.
If we can’t agree on what voltage is “0%”, we’re not going to agree on the other state of charge percentages either. Even for 100% – some charts state that 12.8 V is 100% full, others (like our graph) show 13.0 V as full. This difference of opinion happens because, although a fully charged AGM battery will be close to 13.0 V, the voltage drops very quickly to 12.8V, as you can see. So 12.8 V can be considered to be “fully charged”.
Another complication is that individual batteries differ. A generic chart for “AGM batteries” may not be exactly correct for a specific make and model. The only truly authoritative data is that provided by the manufacturer.
However, the manufacturer’s data can be difficult to interpret, because they do not normally document any simple direct relationship between state of charge and voltage. Instead, they usually publish “constant current discharge” curves, which show how the battery voltage falls over time when discharged at various steady rates, such as 5 amps and 10 amps. That’s interesting, but not directly useful because that’s not how we typically use our batteries – they’re much more likely to have an intermittent load, such as a fridge’s compressor running on and off through the day and lighting in the evening. Given that an AGM battery’s usable capacity is higher when it is lightly loaded, this makes it difficult to directly relate real-world usage to those constant current discharge curves.
Finally, the manufacturer’s data is usually specified at an ambient temperature of 25°C. The battery capacity increases with temperature, and may be down more than 30% at -20°C, and up by 10% or more at 50°C.
All we can really do, in practice, is to use a generic state of charge table, or a graph such as shown above, and decide what the practical minimum voltage for your batteries should be.
Remember that for a reasonably long service live, AGM batteries should not be regularly discharged more than 50%. You could then reasonably decide that your “empty” level is 12.05 V, which corresponds to a 50% state of charge.
Or, for longer life again, you could limit your depth of discharge to 30%, and try to avoid your batteries ever going below 70% SoC, or around 12.30 V.
Lithium iron phosphate batteries
Lithium iron phosphate (LiFePO4) batteries are an increasingly popular alternative to AGM for 12-volt deep-cycle rechargeable battery applications because of their lower weight, increased usable capacity (greater depth of discharge allowed) and longer lifetime.
They do however present a special challenge when it comes to estimating their state of charge, as illustrated by this graph:
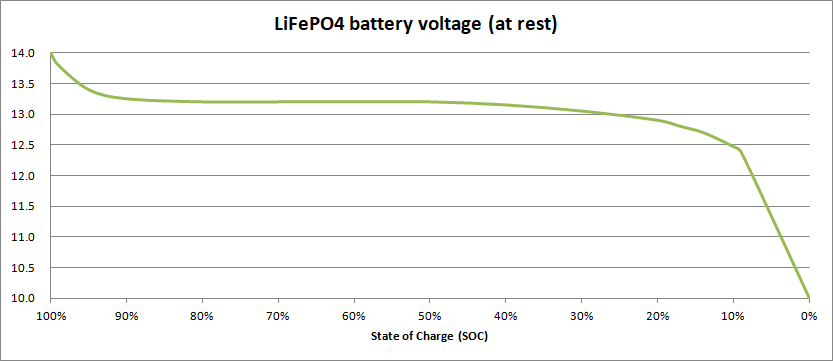
As you can see, in a similar way to lead-acid batteries, they start off with a high voltage (around 14.0 V) which drops quickly to around 13.2 V when discharged. The problem is that the voltage then continues to sit at very close to 13.2 V, right down to 40% SoC, and then continues to decline slowly to around 12.9V at 20% SoC. Only when the state of charge drops below 20% does the voltage begin to change significantly, falling rapidly when the state of charge is less than 10%.
So, if you measure the voltage of a LiFePO4 battery and the reading is 13.2 V, you have no way of knowing whether the battery is 80% full or has dropped to 40%!
Given that to maximise the life of LiFePO4 batteries they should not be regularly discharged by more than 80%, you shouldn’t allow the voltage to fall below 12.9V. Many voltmeters are only accurate to ±0.1 V or so, so it’s quite possible that if you read 13.0 V and think that your battery is at 30%, the voltage is really at 12.9 V and the battery is already at the limit.
The most accurate way to estimate the state of charge of a LiFePO4 battery is through a technique called counting coulombs, where a sophisticated (and relatively expensive) battery monitor measures all the current going into and out of the battery, allowing it to keep track of how much charge is left in it – that’s the technique that your mobile phone, which also also uses a lithium battery, uses.
If you don’t have a battery monitor which can count coulombs, you can nevertheless rely on battery voltage measurements to estimate the state of charge – as long as the measurements are accurate enough.